Disclaimer: The opinions in this article are solely my own and based on personal experience. This is not official AWS guidance. For authoritative information, please consult the AWS Documentation.
Intro
We use averages everywhere in daily life. The average temperature in summer, your average commute time to work, average meat prices at the market (up significantly this past year), etc. They work because they have the normal distribution: a few high values, a few low ones, mostly in the middle:
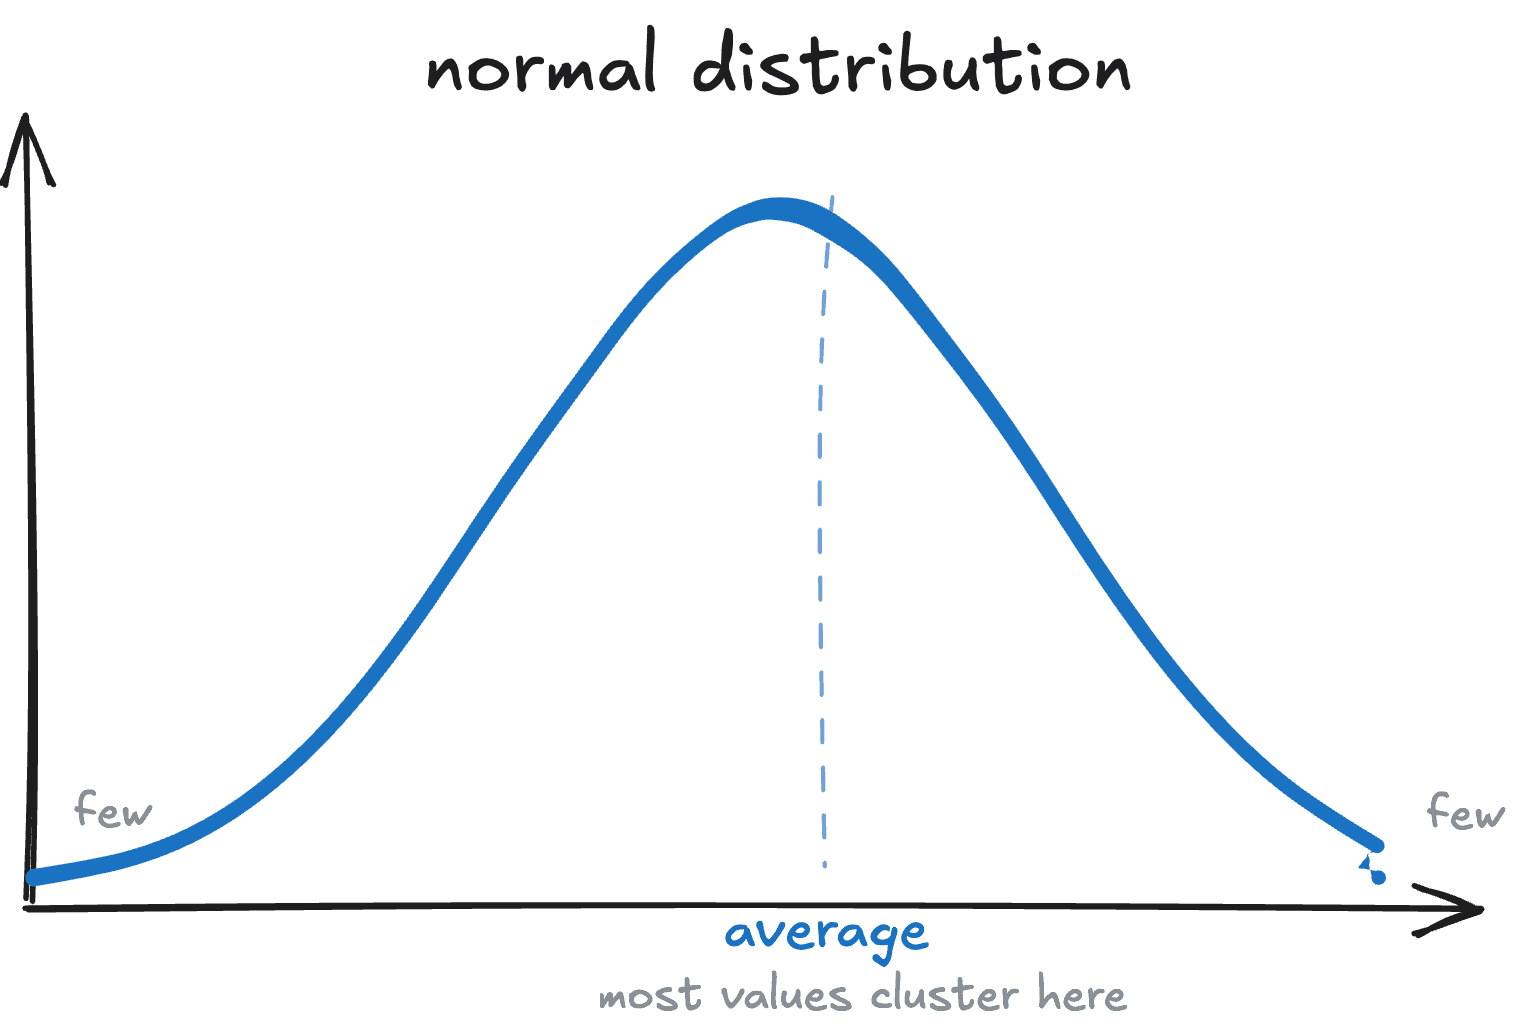
Figure 1: Normal distribution
But some things aren’t normally distributed. Think about money and wealth. Let’s say you have 9 people in the room with average net worth of around $50K, and 10th person comes in with the net worth of $1 million. Then the average net worth in the room changes dramatically: $145K, which is technically correct, but practically useless.
Back to software
When monitoring a software system’s performance, for example the latency1, it is similar to how we look at wealth, more than how we look at temperature. A few slow requests pull the average up, masking what’s actually experienced by your customers.
Latency1 - how long it takes for a system to start responding after a request.
In analogy to our wealth example, say 9 requests to your API complete in 10ms, 1 request takes 10 seconds. If you monitor the average of this latency metric, you would get roughly ~1 second. But the customer experience was completely different, you had a customer who waited for 10 (!) seconds, and for the other 9 requests your system did quite a good job. And the average statistic doesn’t tell anything about either of these:
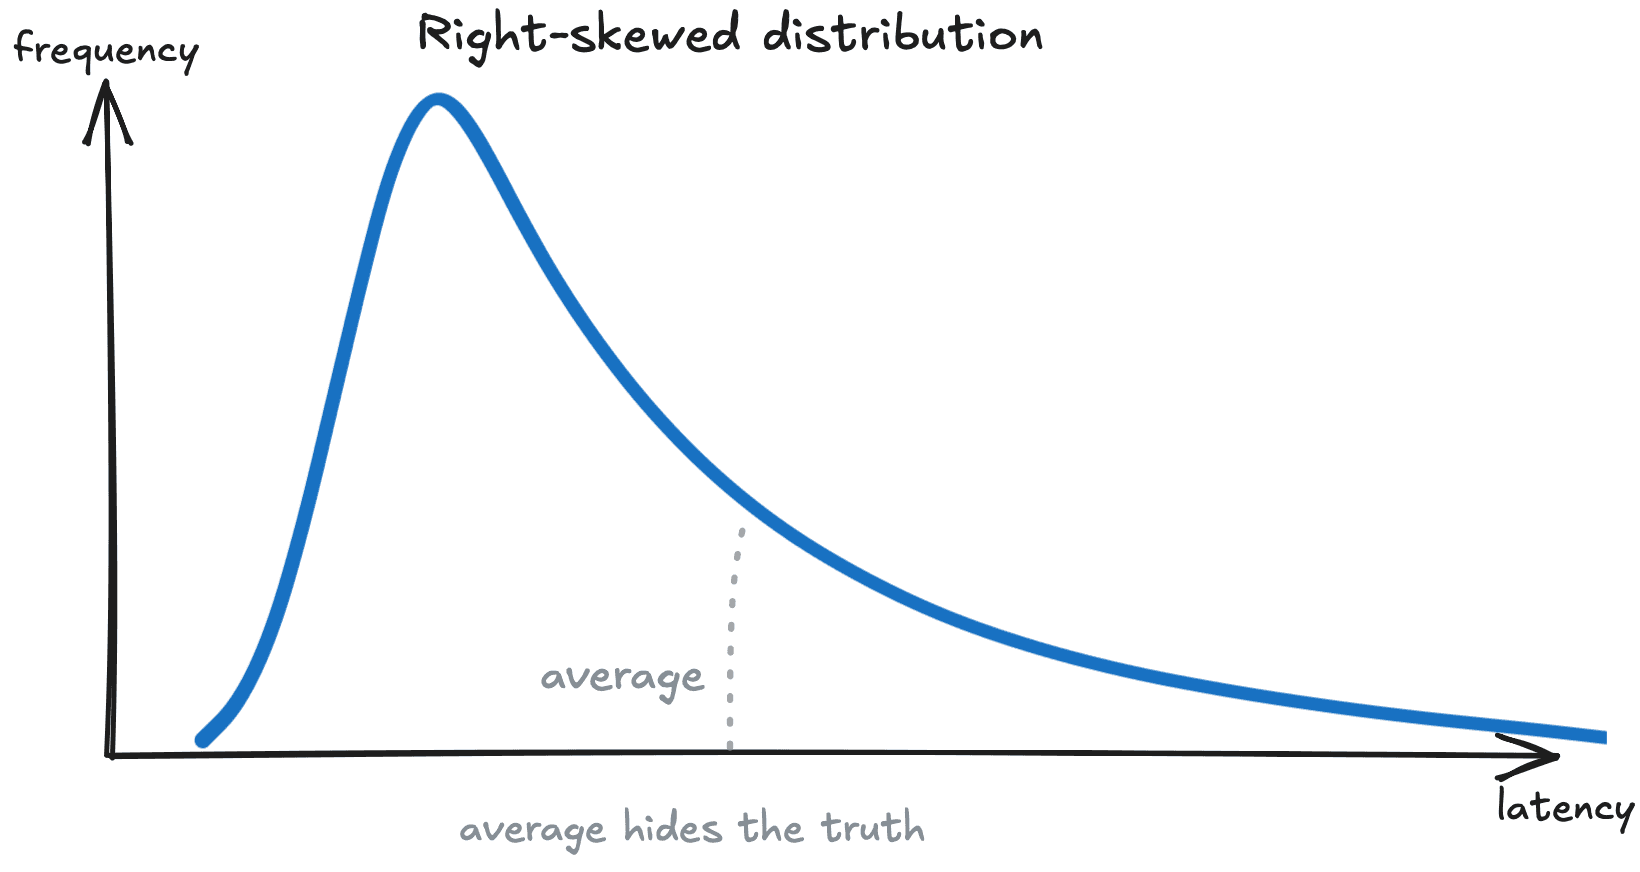
Figure 2: Right-skewed distribution
So what do we use instead?
Instead of asking “what is the average latency?”, we ask “what is the worst experience for 1 in 100 of my customers?”.
This is where we refer to a term from Statistics: percentiles.
A percentile tells the value below which a percentage of data points fall. In software monitoring, commonly tracked percentiles are:
- p50: 50% of requests are faster than this. This is the median, the typical customer experience.
- p90: 90% of requests are faster than this. 1 in 10 customers experiences something slower.
- p99: 99% of requests are faster than this. 1 in 100 customers experiences something slower. This is also usually called tail latency.
- p99.9: 999 in 1000 requests are faster than this. Your worst rare case.
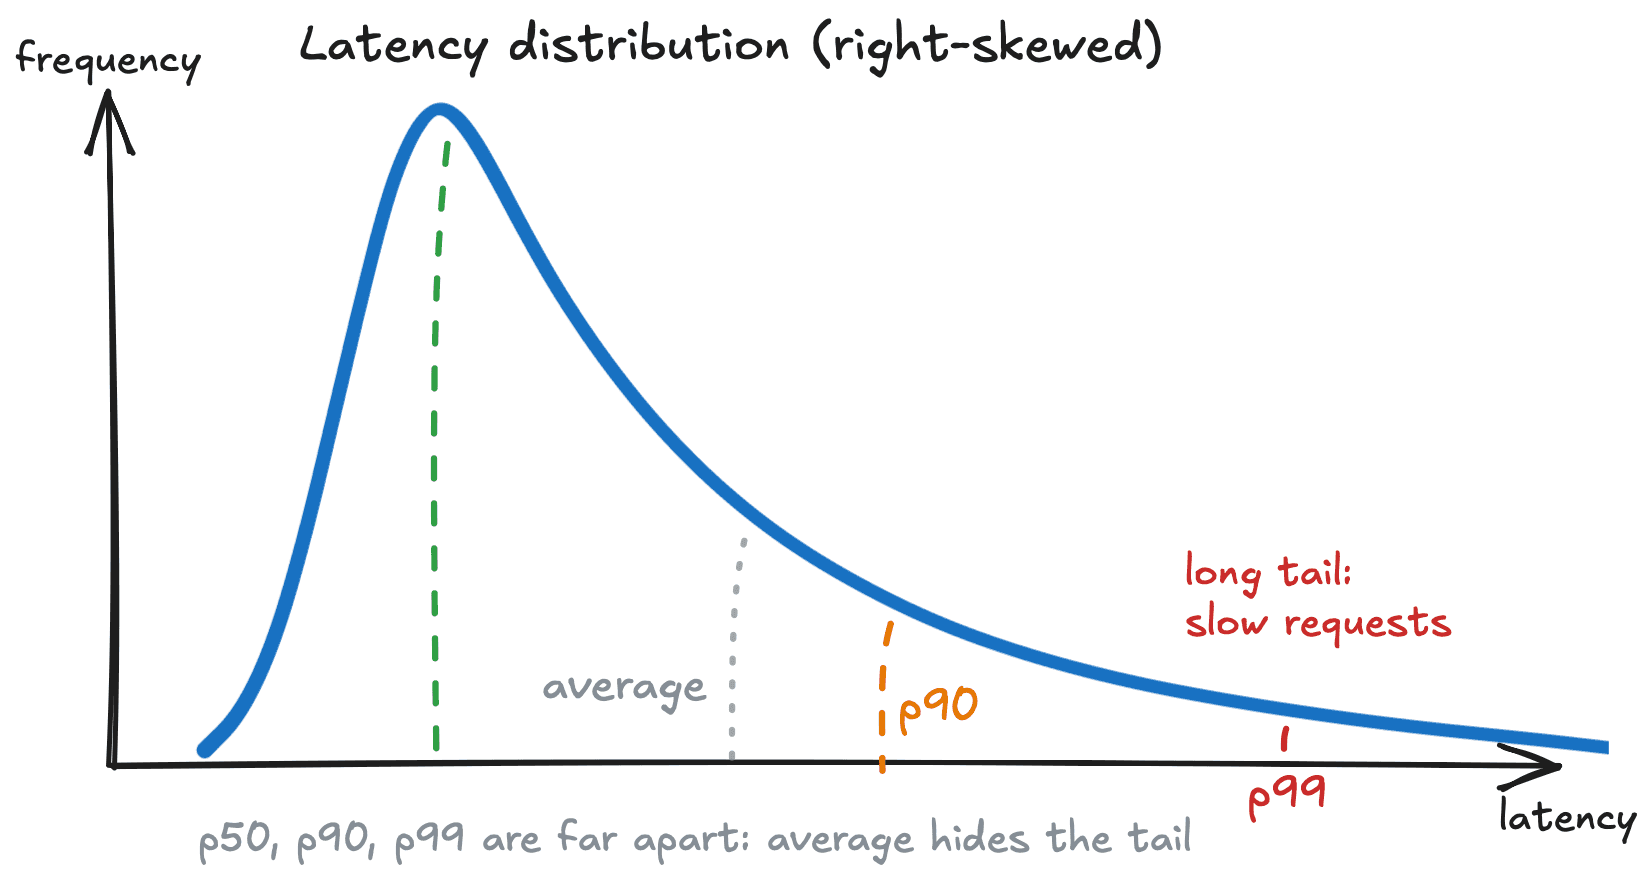
Figure 3: Latency distribution
So in our example above, the p99 would be 10 seconds, immediately telling you something is wrong, while the average was quietly reporting ~1 second.
Why does the tail matter?
At small scale, 1 in 100 slow requests might feel acceptable. But at FAANG scale, with billions of requests per day, the p99 represents the real experience of millions of customers every single day.
This becomes a more apparent problem when you look at microservices. Usually with microservices, a single end-customer API call needs to do multiple internal service calls for authentication, database, business logic, and downstream integrations. If one service has a p99 latency of 100ms, that means 1% of requests to that service are slow. Now say a customer facing action calls 10 such services. The probability that all 10 respond fast is . Which means roughly 1 in 10 customer requests gets hit by at least one slow backend request, even though each individual service looks healthy at p99. At 50 services, the number . So 4 in 10 of your customers are experiencing tail latency somewhere in the chain.
This is why at FAANG, where a single customer action can fan out to dozens of microservices, we care about p99 at every layer.
What I actually look at
When I open a monitoring dashboard, I don’t look at the average first. I look at p99 to understand the worst common case, then p50 to understand the typical experience, and then I compare the two. A large gap between p50 and p99 is usually a red flag: it tells me there is a tail problem worth investigating.
For most production systems at AWS, I set alarms on p99. The average rarely catches real customer-impacting problems fast enough (more on detection here).
Wrapping up
Averages are not wrong or bad. They are the right statistic for normally distributed data. But when your data is skewed (i.e. latency), averages quietly hide the truth about the experience of your customers.
P.S. You need more statistics.